


Expression Is Not the Whole Tissue
A cell's transcriptome says what's active. Its neighbors say which microenvironment it lives in. Flatten the coordinates into a table and tumor boundaries, immune exclusion, and stromal niches all disappear.
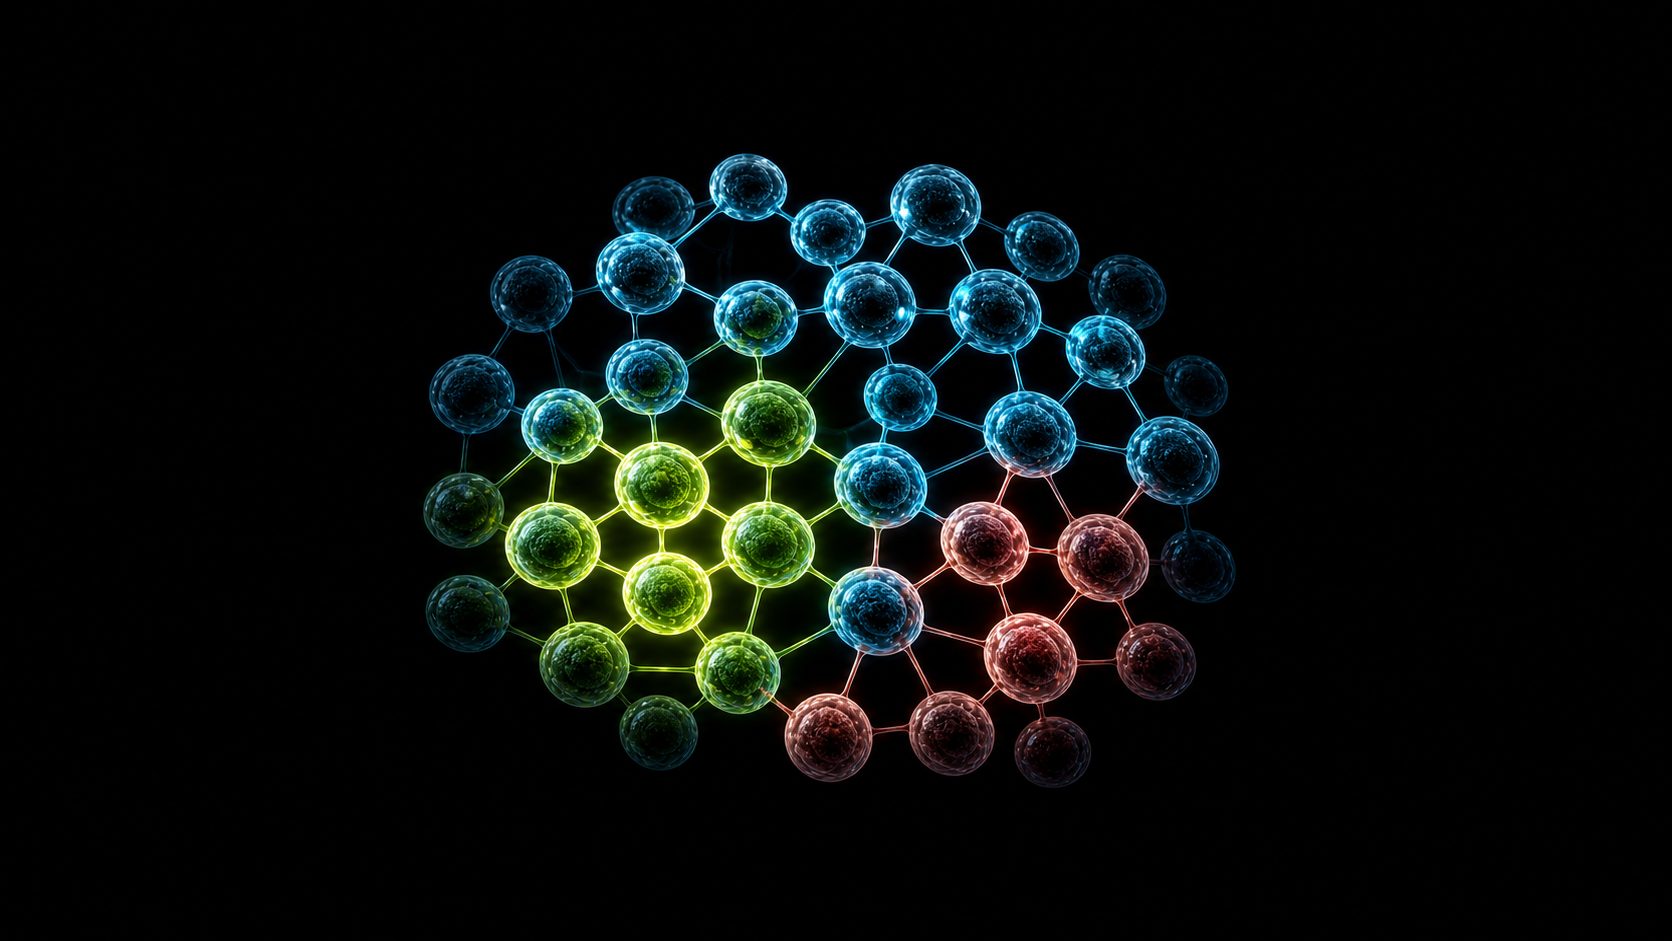
spatialniche builds a k-nearest-neighbor graph straight from spatial coordinates, counts cell-type contacts, and asks whether each pairing beats a label-permuted null model.
Make the Null Model Inspectable
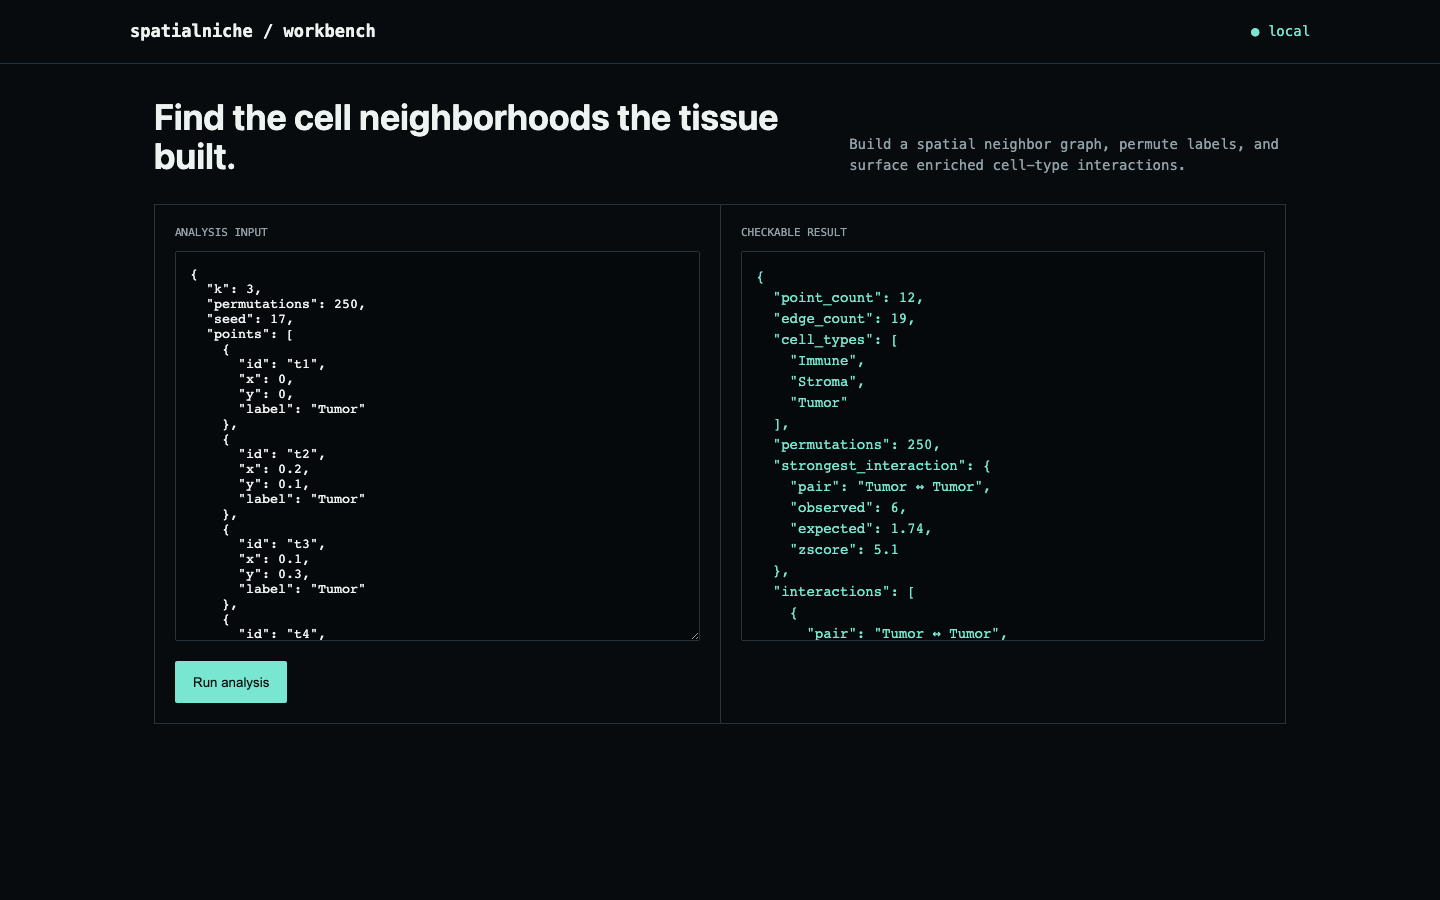
The engine is deterministic: seeded permutations, explicit edge counts, and sortable observed, expected, and z-score output. The same function drives the CLI, the JSON API, the browser workbench, and the tests.
The Demo
Twelve cells produce 19 graph edges. Across 250 permutations, tumor-to-tumor enrichment reaches a z-score of 5.10 and stroma-to-stroma 5.06. Every cross-type pair comes back depleted: immune-tumor at −2.40, immune-stroma at −2.93, and stroma-tumor at −3.43. Three niches, each clustering with its own kind and avoiding the other two.
The compact JSON input is deliberately smaller than AnnData or SpatialData. Segmentation, batch correction, and biological validation stay upstream.
The Missing Pairs, and a Null Worth Trusting
The two strongest depletion signals used to be missing entirely. The engine only tracked pairs that touched at least once, so complete spatial exclusion, the strongest possible way of saying two cell types avoid each other, was dropped instead of reported. It now enumerates every possible pair up front, zero-contact ones included.
Auditing this page, I asked the question a reviewer would: is the z-score actually a z-score? spatialniche.calibration scatters 150 cells across 40 tissues with labels assigned at random. With no structure to find, 6.2% of 240 pair z-scores land beyond 1.96, close to the 5% a calibrated null should give, with a mean z of 0.015. Plant a compact tumor patch and tumor-tumor comes back enriched on every one of the 40 tissues, with a mean z of 5.17, never below 2.3.
So the demo's 5.10 means something: random tissue rarely gets there, and a real niche reliably does. A test holds both properties in CI, alongside a Docker build that has to serve the workbench. 7 tests pass across Python 3.10 through 3.13.
Research Basis
The statistic follows Squidpy's neighborhood-enrichment approach: compare observed cluster contacts against contacts after repeatedly permuting the cluster labels. Read the Squidpy neighborhood enrichment docs.
Try It
No dependencies:
git clone https://github.com/ahmeddoghri/spatialniche && cd spatialniche
pip install -e .
spatialniche demo                    # three niches, z up to 5.10
python -m spatialniche.calibration   # random tissue: ~5% past 1.96
spatialniche analyze your_cells.json # {"points": [{"x":..,"y":..,"label":..}]}
spatialniche serve                   # workbench on :8090